Are breed growth charts really breed specific?
Search for a growth chart for almost any breed and you will find one. Search for two breeds of similar size and you will often find the same numbers under two different names.
That is not necessarily dishonest. But it is worth understanding what a breed growth chart can and cannot be built from, because it changes how much weight to put on the one you are reading — including ours.
The data has no breed dimension in it
The best open source of canine growth data is Salt et al. 2017, published in PLOS ONE from several million bodyweight records. It is the basis for the WALTHAM puppy growth charts and for our own derived reference.
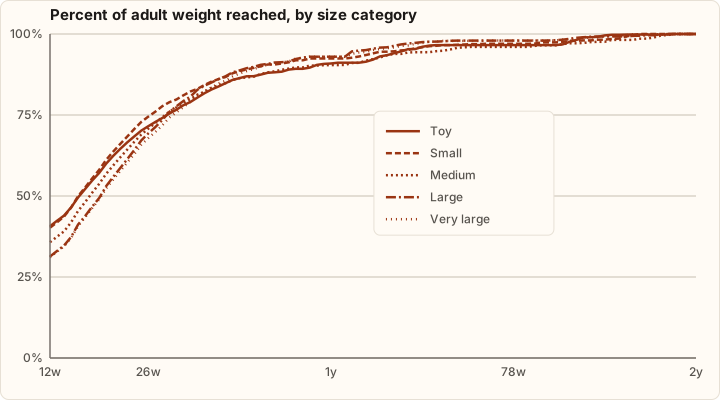
Those authors did not group dogs by breed. They grouped them by adult bodyweight, into five categories:
| Category | Adult weight |
|---|---|
| Toy | under 6.5 kg |
| Small | 6.5 to 9 kg |
| Medium | 9 to 15 kg |
| Large | 15 to 30 kg |
| Very large | 30 to 40 kg |
They did that because adult weight is what predicts a growth curve. A 25 kg dog grows like other 25 kg dogs regardless of what is written on its pedigree, far more closely than it grows like other dogs of its own breed at different sizes.
So when a site shows you a “Labrador growth chart”, the curve underneath it is almost certainly a size-category curve like this one, which covers every breed expected to finish between 30 and 40 kg:
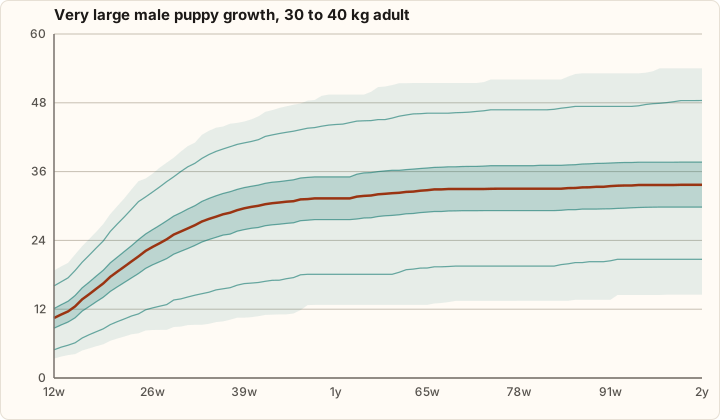
There is no Labrador-specific dataset of that quality to draw from.
What a breed page can honestly add
Here is the distinction that matters, and the one our breed pages are built on.
A growth curve has a shape and a scale.
The shape — what percentage of adult weight a puppy has reached at each age — comes from the size category, and it transfers well. Dogs of similar adult size really do follow similar trajectories.
The scale — the actual kilograms — does not come from the category, and this is where most breed charts go wrong. The toy category covers everything under 6.5 kg, so its median adult is about 4.5 kg. Publish that as the expected adult weight of a Pomeranian and you are out by nearly a factor of two, because the AKC standard for a Pomeranian is 3 to 7 pounds, around 2.3 kg.
We measured that drift across every breed in our dataset. Against the category median, the Pomeranian runs 1.94×, the Toy Poodle 1.99×, the Yorkshire Terrier and Maltese both 1.40×. Those are not edge cases. They are some of the most searched breeds there are.
So the scale has to come from somewhere breed-specific, and the only citable source for that is the published breed standard. Our breed pages take the AKC’s own adult weight range and apply the category’s percentage curve to it. Shape from the category, scale from the standard.
That is a smaller claim than “breed-specific growth chart”. It is also one we can defend.
How to read a breed chart, yours or anyone else’s
Check where the adult weight comes from. If the chart’s final row does not match the breed standard, it is a category curve with a breed name on it.
Check whether two similar breeds get different numbers. They should, if their standards differ. Ours do: a Bulldog and a Siberian Husky share a size category and therefore a percentage curve, but their weight tables are not the same, because the AKC gives 50 pounds for a Bulldog male and 45 to 60 for a Husky.
Watch for the category boundaries. They are lines drawn through a continuum and they produce genuine oddities. By average adult weight across both sexes, the Labrador Retriever comes out at 30.6 kg and the Golden Retriever at 29.5 kg, which puts two very similar dogs in different categories with slightly different curves. Neither is wrong. It is a reminder that a category is a bucket, not a measurement of your dog.
Check the ceiling. The reference stops at 40 kg of adult bodyweight. Any chart confidently plotting a Mastiff or a Great Dane against it is extrapolating past the data. Ours say so on the page; most do not.
What actually beats a breed chart
Your own puppy’s weight.
A breed standard describes a target that plenty of healthy dogs sit outside. Once you have a real weight at a real age, the puppy weight calculator can place your puppy on a centile and follow that centile forward, which uses information no breed chart has: this specific dog. Two weigh-ins are better still, because the growth calculator can then look at the trajectory rather than a single point.
For a mix, skip breed charts entirely. The mixed breed calculator works from current weight and age, which is the only thing that means anything when the standard does not apply.
The short version
A breed growth chart built on a size category is not useless — the shape is real and it is well evidenced. It just is not what the label implies, and the difference shows up most in exactly the small breeds people search for most. Ask any chart where its adult weight comes from, and if the answer is not the breed standard, treat the kilograms with suspicion and the percentages with respect.
Related guides
- How big will my puppy get? What actually predicts your puppy's adult size, which rules of thumb work, and which quietly fail. Read this before you trust any single number.
- Are puppy weight calculators accurate? How close puppy weight predictors really get, measured against 579,135 real outcomes, and what the honest margin of error is at each age. See the numbers.
- Working out mixed breed size without a DNA test How to work out how big a mixed breed puppy will get using parent weights and its own growth curve, and when a DNA test is worth it. Estimate yours free.
Calculators for this
References
Every figure on this page comes from one of these. Full details, including what each source is used for, are on our sources page.
- Salt C, Morris PJ, German AJ, Wilson D, Lund EM, Cole TJ, Butterwick RF. Growth standard charts for monitoring bodyweight in dogs of different sizes. PLOS ONE. 2017;12(9):e0182064. doi:10.1371/journal.pone.0182064
- American Kennel Club. Official Breed Standards.
- WALTHAM Petcare Science Institute. Puppy Growth Charts.